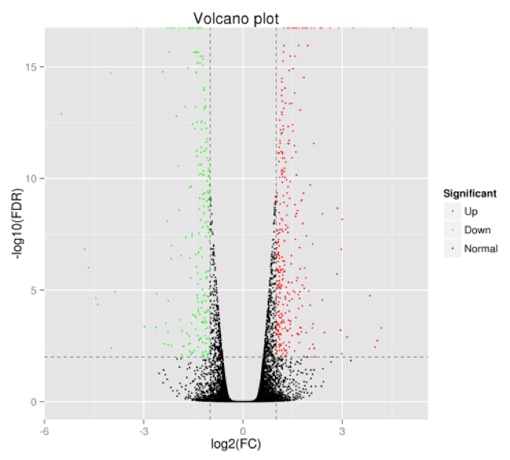
Volcano Plot Service

توضیحات محصول
In statistics, a volcano plot is a kind of scatter plot that is applied to quickly seek out changes in large data sets composed of replicate data. It plots fold-change versus significance on the x and y axes, respectively. These plots are increasingly widely used in omic experiments such as genomics, transcriptomics, proteomics, and metabolomics where one usually has a long list of many thousands of replicate data points between two distinct conditions and one wants to quickly identify the most significant changes. A volcano plot combines a measure of statistical significance from a statistical test (e.g. a p value from an ANOVA model) with the magnitude changes, enabling quick visual determination of these data-points that represent large magnitude changes that are also statistically significant.
more: http://globalcatalog.com/proteomics.as/en/new-pro9223372036854775807?catId=64651

